To become the most successful trader out there you need to constantly evolve and learn new things. It might be hard to keep up with the trends, find new indicators and remember all the important trading events. That’s why you have us - to explain things as simple as they can be.
Triangles are quite a common pattern in trading and can tell us a lot about the volatility of the asset, as well about trading opportunities that lie ahead. There are 3 the most important types of triangles you can find on a chart.
Symmetrical triangle
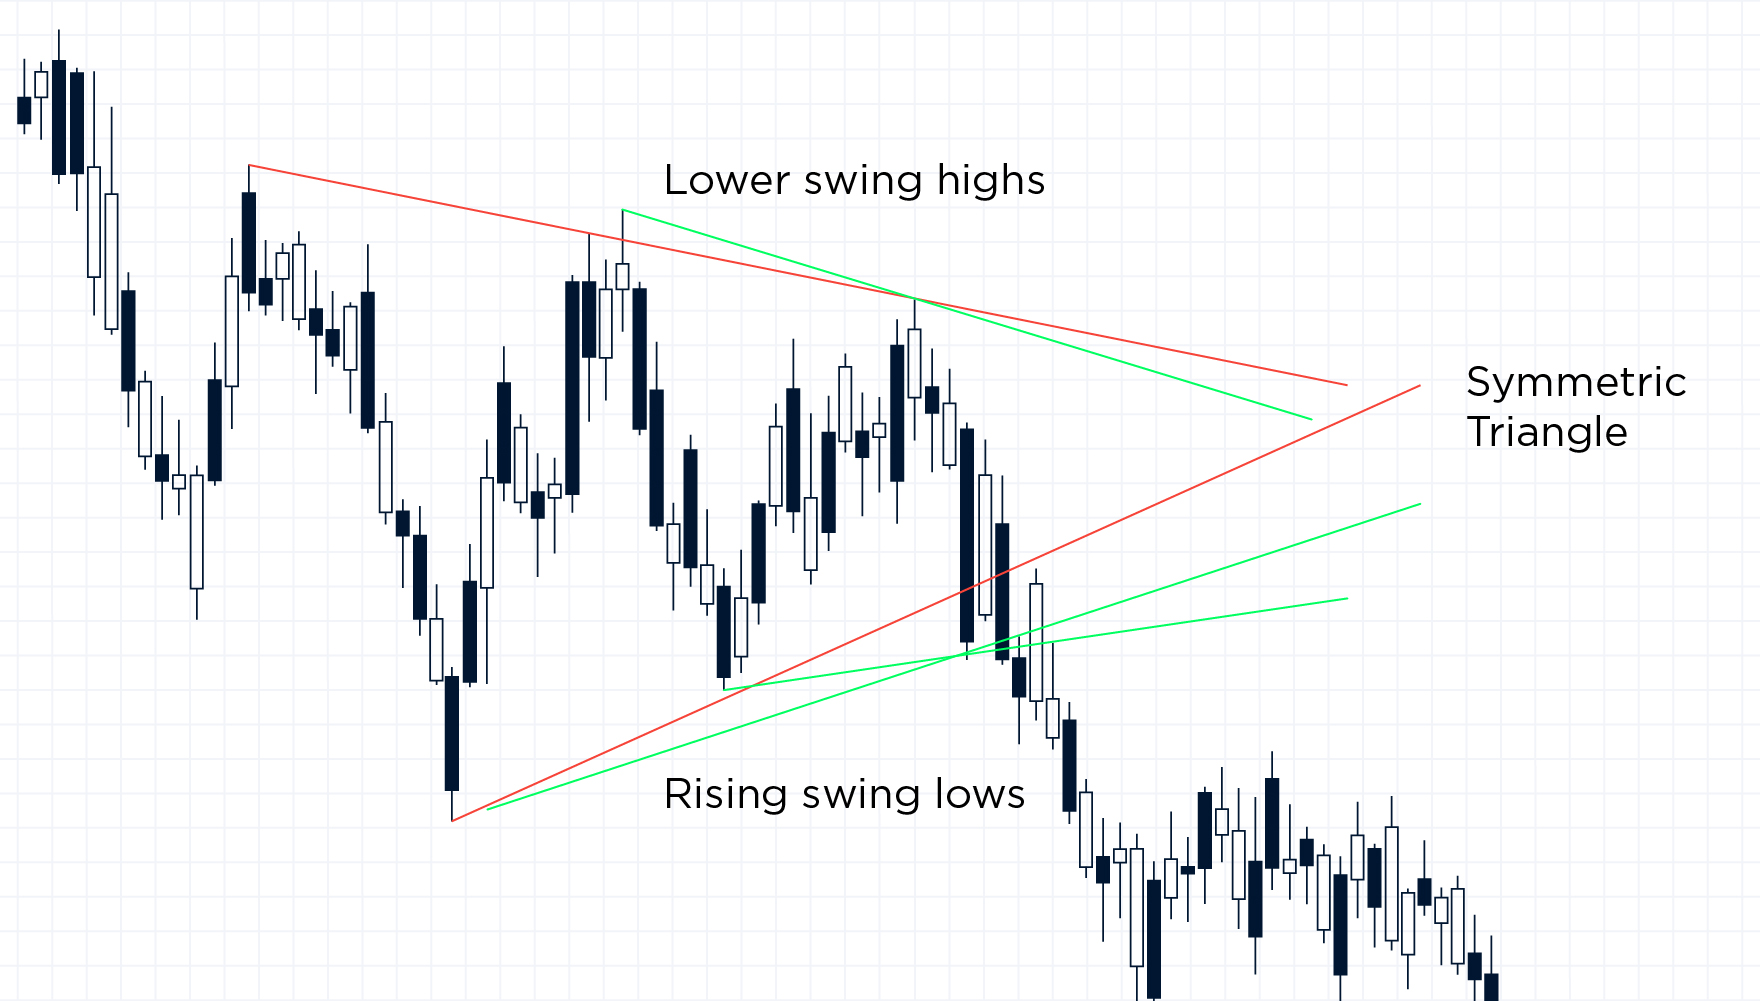
Have you ever looked at a chart and seen a clear pattern - the highs and lows of a price are becoming more and more close to the middle line? Like a calming sea, the “waves” of a chart are becoming less and less high and the deeps - less and less low.
In other words, if you make support and resistance line for both highs and lows, they will connect at a certain point, forming a symmetrical triangle.
Pro-tip: you can draw the triangle at least after 3 price change swings.

Ascending triangle
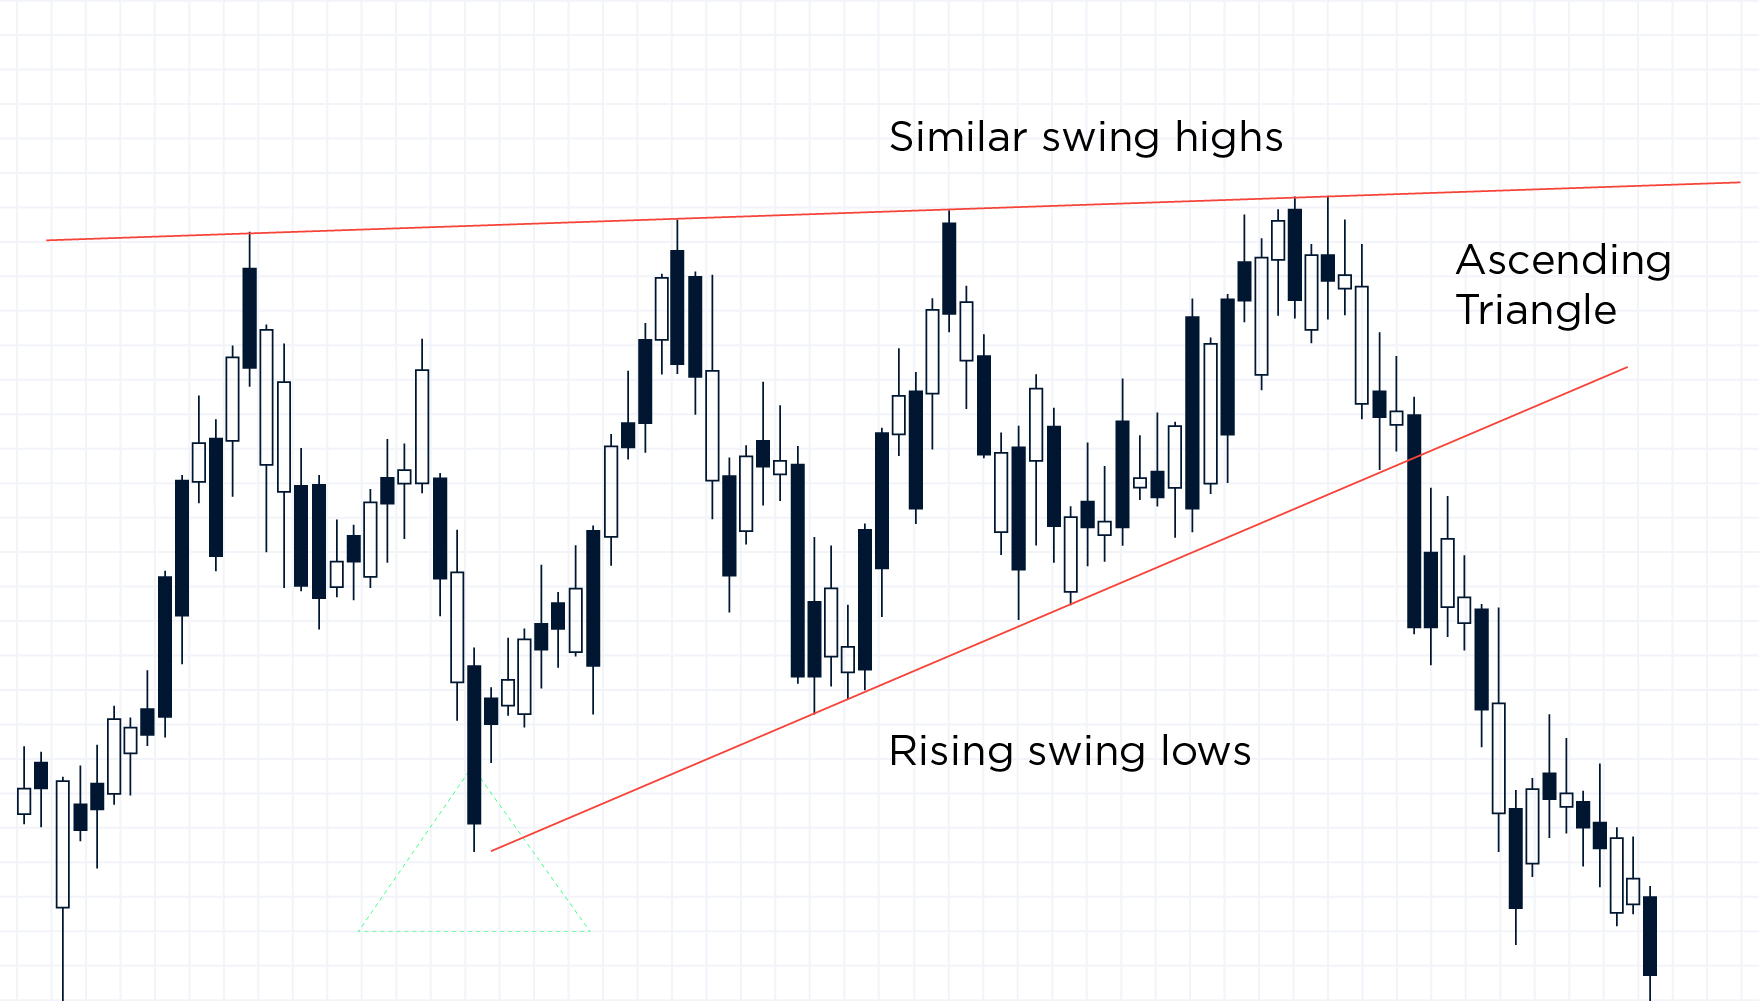
In this case, each price peak stays at the same level more or less, whereas low of the chart move closer and closer to the middle line. If you connect the highs and the lows, you will get a triangle with unequal sides, the bottom side of it going up.
You need to wait at least 2 highs and lows before drawing this figure on your chart.

Descending triangle
The exact opposite of the ascending triangle, it’s mirror-twin, descending triangle demands an approximately equal level of price lows. High points, however, are getting lower and lower, and you need to connect all the dots in order to get your reversed triangle.
Don’t forget to wait for your standard 2 highs and lows to make sure you can draw this figure!

What about risks?
For many traders assume that in order to get big rewards, you need bigger risks. That’s not always true, let’s face it. Moreover, modern Forex trading provides a lot of possibilities to manage your risks and still get a pretty high chance to get big profit.
- Always use a Stop Loss option. Even if you are sure in your prognosis, even if all the indicators confirm it, you still need to play safe to the extent. Control your risks, show them who’s the boss here!
- Calculate your position sizes. Usually, professional traders don’t risk more than 1% of their account balance per trade. It doesn’t have to apply to your trading style all the time, but you can try it on your demo balance to see whether that helps stabilize your profit/loss ratio.
- Be aware of slippage. Monitor market news to make sure your prognosis isn’t sabotaged by some newsflash.
Overall, technical analysis can definitely help you with your trading strategy. Triangles are very common but don’t expect to find them in each and every chart on each and every asset you trade on. You can practice and look for them looking at price charts for earlier dates and see whether you can find them and what this information can bring for you to incorporate into your trading.


